SAT Problem-Solving and Data Analysis – FREE Exercises and Practices
The SAT exam has around 5 to 7 SAT Problem-Solving and Data Analysis content domain questions out of 44 SAT Math questions. This makes up around 15% of the SAT Math. While the majority of the questions are easy to solve, some SAT Problem-Solving and Data Analysis questions are tricky. Knowing the important points about the content domain and practicing as many SAT Problem-Solving and Data Analysis practice questions as possible will double your chances of getting a high SAT Math score.
In this article
📌 Hint: Do not skip this article; you will find FREE SAT Math Prep resources throughout the article.
We’ve listed the most important and frequently occurring concepts in this SAT Problem-Solving and Data Analysis post. You will see SAT Problem-Solving and Data Analysis practice test questions and exercises, in total 15 SAT Problem-Solving and Data Analysis questions with rationales all for FREE.
💡You might be interested in reading the Digital SAT Math Prep post.
SAT Problem-Solving and Data Analysis Content Domain
SAT Problem-Solving and Data Analysis content domain measures the ability to apply quantitative reasoning about ratios, rates, and proportional relationships; understand and apply unit rate; and analyze and interpret one- and two-variable data. This group of skills is about being quantitatively literate and demonstrating a command of math that resonates throughout college courses, career training programs, and everyday life.
💡You might be interested in reading the Digital SAT Math Ultimate Guide post. We have provided further details about the SAT Math structure, examples of easy, medium, and hard questions, answers, rationales, and frequently asked questions about the SAT Math.
Anna B. Scored 800 on SAT Math!
Anna B. is one of our thousands of successful SAT students. She scored 800 on SAT Math. You can watch her SAT story.
SAT Problem-Solving and Data Analysis Skills and Knowledge Testing Points
The SAT exam will have around 5 to 7 questions from the Problem-Solving and Data Analysis content domain. There are 7 skills and knowledge testing points in the SAT Problem-Solving and Data Analysis content domain:
-
- Ratios, rates, proportional relationships, and units
- Percentages
- One-variable data: distributions and measures of center and spread
- Two-variable data: models and scatter plots
- Probability and conditional probability
- Inference from sample statistics and margin of error
- Evaluating statistical claims: observational studies and experiments
Let’s review the important points you should know for each of the SAT Problem-Solving and Data Analysis skills and knowledge below.
👉 Take our full-length FREE SAT Practice Test, see where you stand!
SAT Problem-Solving and Data Analysis Topic 1: Ratios, Rates, Proportional Relationships, and Units
A brief overview of the importance of understanding ratios, rates, proportional relationships, and units in everyday life and their significance in the SAT Math section.
1. Understanding Ratios
Definition: A ratio is a comparison of two quantities that shows the relative sizes of two or more values.
Examples:
The ratio of apples to oranges is 3:2.
The ratio of boys to girls in a class is 5:3.
Representation: Ratios can be represented as fractions  , with a colon (a:b), or in words (“a to b”).
2. Exploring Rates
Definition: A rate is a special type of ratio where the two quantities being compared have different units.
Examples:
Speed as miles per hour (mph).
Price as dollars per pound.
Unit Rate: The rate per one unit (e.g., cost per item).
3. Proportional Relationships
Definition: Two quantities are proportional if they maintain a constant ratio or rate.
Mathematical Form: If  , then a.d = b.c (cross multiplication).
Solving Proportions: How to solve for an unknown in a proportional relationship using cross multiplication.
4. Units and Unit Conversions
Importance of Units: Units provide context to numerical values and are crucial in understanding and solving real-world problems.
Dimensional Analysis: A technique to convert one unit to another using conversion factors.
Examples of Unit Conversions:
Converting inches to centimeters.
Converting gallons to liters.
Converting miles per hour to feet per second.
5. Applications of Ratios, Rates, and Proportional Relationships
Mixture Problems: Determining concentrations in solutions.
Scale Models and Drawings: Understanding maps and architectural drawings.
Speed, Distance, and Time Problems: Using the formula Distance=Speed x Time.
6. Common Mistakes and How to Avoid Them When Solving SAT Problem-Solving and Data Analysis Questions
- Misinterpretation of Ratios and Rates: Common errors in understanding or applying ratios and rates.
Unit Inconsistencies: Importance of consistent units when performing calculations.
Errors in Proportional Reasoning: Avoiding mistakes in setting up and solving proportions.
7. Practice Questions
- Ratios: If a recipe requires a 3:2 ratio of flour to sugar and you have 9 cups of flour, how much sugar do you need?
- Rates: A car travels 150 miles in 3 hours. What is the car’s speed in miles per hour? How far will it travel in 5 hours at this speed?
- Proportional Relationships: On a map, 1 inch represents 5 miles. If two cities are 7 inches apart on the map, what is the actual distance between them?
- Unit Conversions: A runner completes a race in 45 minutes at an average speed of 8 kilometers per hour. How long is the race in kilometers?
💡We’ve prepared a 7-Step Digital SAT Math Study Guide helping students to prepare their unique SAT Math Study Guide.
Watch SAT Math Prep Online Course – Sample Lecture on YouTube
We have a sample 8-minute video lecture from our SAT Math Prep Online Course on YouTube. You can watch below.
SAT Problem-Solving and Data Analysis Topic 2: Percentages
Percentages are a way to express numbers as parts of a whole, where the whole is 100. For example, 50% means 50 out of 100, or half of a whole.
Conversion Tips:
To convert a percentage to a decimal, divide by 100. (e.g., 25% = 0.25)
To convert a decimal to a percentage, multiply by 100. (e.g., 0.75 = 75%)
To convert a fraction to a percentage, divide the numerator by the denominator and multiply by 100. (e.g., 1/4 = 0.25 = 25%)
Basic Percentage Calculations
Finding a Percentage of a Number: To find x% of a number, multiply the number by (x100).
Example: 20% of  = 30")
Percentage Increase or Decrease: /(Original Value) . 100")
Example: If a shirt price increases from $40 to $50, the percentage increase is
/40 . 100 = 25")
Advanced Percentage Problems
Problems with Unknowns: These often involve setting up an equation. For example, “What number is 15% of x?” translates to 0.15x = Given Number
Compound Percentages: When calculating multiple percentage changes, it’s essential to apply them sequentially, not add them.
Example: A price increases by 10% and then decreases by 10% is not a net 0% change but rather: 1.10 . 0.90=0.99, a 1% decrease.
Free Digital SAT Prep Course
SFBS offers a Free Digital SAT Prep Online Course. The course goes through particular skills and knowledge testing points and improves your problem-solving skills and test-taking strategies.

SAT Problem-Solving and Data Analysis Topic 3: One-variable Data: Distributions and Measures of Center and Spread
One-variable data (or univariate data) consists of observations on a single characteristic or attribute. Examples include test scores, heights, weights, or any data that can be listed in a single column.
Data Distributions
A distribution tells us how data values are spread out. It is vital to understand the shape of the data distribution as it informs which measures of center and spread are most appropriate.
Types of Distributions:
- Uniform Distribution: All values occur with roughly the same frequency.
- Symmetric Distribution: The left and right sides of the distribution are approximately mirror images.
- Skewed Distribution: Data is not symmetric. Skewed left means the tail is longer on the left side, and skewed right means the tail is longer on the right side.
Visual Representations:
- Histograms: Useful for showing frequency distributions for continuous data.
- Dot Plots: Show each individual data point, useful for small data sets.
- Box Plots: Display the five-number summary (minimum, first quartile, median, third quartile, maximum) and are useful for showing spread and identifying outliers.
Measures of Center
Mean: The average of all data points.
Formula: Mean= ⅀Data Points / Number of Data Points
Median: The middle value when the data points are arranged in order. If there is an even number of data points, the median is the average of the two middle numbers.
Mode: The most frequently occurring value(s) in the data set.
🖋️ Mean, Median, and Mode is a frequently occurring concept in SAT Problem-Solving and Data Analysis questions.
Measures of Spread
Range: The difference between the maximum and minimum values in a data set.
Formula: Range=Maximum−Minimum
Interquartile Range (IQR): The range of the middle 50% of the data.
Formula: IQR = Q3 − Q1 (where Q1 is the first quartile and Q3 is the third quartile)
Standard Deviation: A measure of the average distance of each data point from the mean. A higher standard deviation indicates more spread-out data.
Variance: The square of the standard deviation, represents the spread of the data points.
Analyzing Data Using Measures of Center and Spread
When analyzing data:
- Use the mean for symmetric distributions without outliers.
- Use the median for skewed distributions or distributions with outliers.
- Use the mode when the most common item or category is needed.
- The range gives a basic measure of spread, but the IQR is better for skewed data or data with outliers.
- Standard deviation is useful for understanding the spread of data relative to the mean.
📚 San Francisco Business School offers a vast amount of FREE Digital SAT Prep Online materials. See it on the Free Digital SAT Prep Online Library.
Digital SAT Prep Online Course Program
San Francisco Business School offers a comprehensive Digital SAT Prep Online Course taught by 99th-percentile SAT Instructors and exam experts. The program cracks down each content domain, skills, and knowledge testing point through 1,000+ realistic Digital SAT Exam questions. You will see all the different types of questions that may appear in Digital SAT.

SAT Problem-Solving and Data Analysis Topic 4: Two-variable Data: Models and Scatterplots
Two-variable data (bivariate data) involves pairs of linked numerical observations. For example, analyzing the relationship between hours studied and test scores, or the relationship between height and weight.
Independent Variable (Explanatory): The variable that is presumed to cause or influence the other variable.
Dependent Variable (Response): The variable that is affected or influenced by the independent variable.
Understanding Scatterplots
A scatterplot is a graph that shows the relationship between two sets of data. Each point on the graph represents a pair of values.
Constructing a Scatterplot:
- Identify the variables (independent and dependent).
- Label the x-axis (independent variable) and y-axis (dependent variable).
- Plot each data pair as a point on the graph.
Interpreting Scatterplots:
- Look for patterns or trends.
- Identify clusters of data points.
- Note any outliers that don’t fit the general pattern.
Types of Relationships in Scatterplots
- Positive Correlation: As one variable increases, the other variable also increases.
- Negative Correlation: As one variable increases, the other variable decreases.
- No Correlation: There is no apparent relationship between the two variables.
Linear Relationship: Points roughly follow a straight line.
Non-Linear Relationship: Points form a curve or some other shape.
Line of Best Fit (Trend Line)
The line of best fit (trend line) is a straight line that best represents the data on a scatterplot. It is used to predict values and understand the relationship between variables.
Drawing a Line of Best Fit:
- Ensure the line has about as many points above it as below.
- The line should follow the general direction of the data points.
🖋️ Line of Best Fit is a frequently occurring concept in SAT Problem-Solving and Data Analysis questions.
Using the Line of Best Fit:
- Make predictions based on existing data.
- Understand trends and potential relationships.
Calculating the Equation of a Line of Best Fit
Slope-Intercept Form: The equation of a line can be written as y=mx+b, where:
- m is the slope (rise over run).
- b is the y-intercept (where the line crosses the y-axis).
Calculating the Slope (m):
 / (Change of x) = (y_2 - y_1)/(x_2 - x_1)")
Finding the Intercept (b):
Use a point on the line (x,y) and the slope m to solve for b.
Residuals: The difference between observed values and the values predicted by the line of best fit. A smaller sum of squared residuals indicates a better fit.
Correlation Coefficient and Strength of Relationship
The correlation coefficient (r) measures the strength and direction of a linear relationship between two variables.
Interpreting r:
- r = 1 : Perfect positive linear correlation.
- r = −1 : Perfect negative linear correlation.
- r = 0 : No linear correlation.
- 0.7 < |r| ≤ 1: Strong correlation.
- 0.3 < |r| ≤ 0.7: Moderate correlation.
- 0 ≤ |r| ≤ 0.3: Weak correlation.
Note that this topic is strongly related to linear equations in two variables. You may revisit that section in our SAT Algebra post to memorize it.
Free Digital SAT Prep Course
SFBS offers a Free Digital SAT Prep Online Course. The course goes through particular skills and knowledge testing points and improves your problem-solving skills and test-taking strategies.
SAT Problem-Solving and Data Analysis Topic 5: Probability and Conditional Probability
Probability measures the likelihood that a specific event will occur. It is expressed as a number between 0 (impossible event) and 1 (certain event).
Key Terms:
- Experiment: A procedure that can be infinitely repeated and has a well-defined set of possible outcomes (e.g., flipping a coin).
- Outcome: A possible result of an experiment (e.g., getting heads in a coin flip).
- Event: A set of one or more outcomes (e.g., getting heads in a coin flip is an event).
- Sample Space: The set of all possible outcomes (e.g., for a coin flip, the sample space is {Heads, Tails}).
1. Basic Probability Principles
Simple Probability: The probability of an event A occurring is calculated as:
 = (Number of Favorable Outcomes)/(Total Number of Outcomes)")
Example: The probability of rolling a 3 on a standard 6-sided die:
P(3) = 16
Complementary Events: The probability of an event not occurring is:
P(A′) = 1− P(A)
2. Compound Events
Compound events involve the combination of two or more events.
Independent Events: Two events are independent if the occurrence of one does not affect the occurrence of the other.
P(A∩B) = P(A) × P(B)
Dependent Events: Two events are dependent if the occurrence of one event affects the occurrence of the other.
P(A∩B) = P(A) x P(B | A)
Addition Rule:
- Mutually Exclusive Events: Events that cannot happen at the same time.
P(A∪B) = P(A) + P(B) - Non-Mutually Exclusive Events: Events that can occur at the same time.
P(A ∪ B) = P(A) + P(B) − P(A∩B)
3. Conditional Probability
Conditional probability is the probability of an event occurring given that another event has already occurred.
Formula:
P(A∣B) = P(A∩B) / P(B)
Example: The probability of drawing a red card from a deck given that the card is a face card.
4. Using Venn Diagrams and Tables
Venn Diagrams: Useful for visualizing relationships and overlaps between events.
Two-Way Tables: Organize data to calculate joint, marginal, and conditional probabilities.
5. The Multiplication Rule for Independent and Dependent Events
Independent Events:
P(A∩B) = P(A) × P(B)
Dependent Events:
P(A∩B) = P(A) × P(B∣A)
6. Bayes’ Theorem (Introduction)
Bayes’ Theorem helps calculate conditional probabilities in reverse.
Formula:
P(A∣B) = [P(B∣A)×P(A)] /P(B)
Application: Used in various problems to update the probability of an event based on new evidence.
Tips for SAT Problem-Solving and Data Analysis Probability Problems
- Be careful with “at least” and “at most” phrases.
- Check if events are mutually exclusive or independent.
- Practice using the formulas and understanding when to apply each.
Digital SAT Prep Online Course Program
San Francisco Business School offers a comprehensive Digital SAT Prep Online Course taught by 99th-percentile SAT Instructors and exam experts. The program cracks down each content domain, skills, and knowledge testing point through 1,000+ realistic Digital SAT Exam questions. You will see all the different types of questions that may appear in Digital SAT.
SAT Problem-Solving and Data Analysis Topic 6: Inference from Sample Statistics and Margin of Error
Statistical inference involves drawing conclusions about a population based on a sample taken from that population. Since it’s often impractical to collect data from an entire population, statisticians use samples to make educated guesses (inferences) about population parameters.
Population: The entire group that you want to draw conclusions about.
Sample: A subset of the population that is used to make inferences about the population.
1. Sample Statistics
Sample Statistics are numerical values calculated from a sample, which are used to estimate population parameters (e.g., population mean or population proportion).
Key Sample Statistics:
- Sample Mean (x̄): The average of all sample observations.
- Sample Proportion (p̂): The proportion of sample observations that meet a specific criterion.
- Sample Standard Deviation (s): A measure of the variability or spread of sample observations.
- Law of Large Numbers: As the size of the sample increases, the sample mean will get closer to the population mean.
2. Sampling Distribution
Sampling Distribution: The probability distribution of a sample statistic (like the mean) based on many samples from the same population.
Central Limit Theorem: Regardless of the population’s distribution, the sampling distribution of the sample mean will approach a normal distribution as the sample size increases.
Standard Error (SE): The standard deviation of the sampling distribution of a sample statistic.

where s is the sample standard deviation and n is the sample size.
3. Confidence Intervals
Confidence Interval (CI): A range of values, derived from a sample statistic, that is likely to contain the population parameter.
Confidence Interval for a Population Mean:
CI=x̄ ± 
where z is the z-score corresponding to the desired confidence level.
Interpretation: A 95% confidence interval means that if we were to take many samples and compute a confidence interval for each sample, approximately 95% of those intervals would contain the true population mean.
4. Margin of Error
Margin of Error (MOE): The maximum amount by which the sample statistic is expected to differ from the true population parameter.
Calculating the Margin of Error:
MOE=
Factors Affecting the Margin of Error:
- Sample Size: Larger samples produce smaller margins of error.
- Variability: Greater variability in the data increases the margin of error.
- Confidence Level: Higher confidence levels produce larger margins of error.
5. Inference from Sample Statistics
Inference: Drawing conclusions about the population based on sample data. Confidence intervals and margins of error help quantify the uncertainty in these inferences.
Example: Estimating the average height of students in a school by measuring a sample of 50 students. Using the sample mean and margin of error, you can estimate the population mean height with a specified level of confidence.
SAT Problem-Solving and Data Analysis Topic 7: Evaluating Statistical Claims: Observational Studies and Experiments
Statistical claims are assertions about data or a population based on a study or research. Evaluating these claims critically is crucial because data can be misrepresented or misunderstood.
Key Questions to Ask:
- What is the source of the data?
- How was the data collected?
- Is the claim based on an observational study or an experiment?
- Are there any biases or confounding factors that could affect the results?
1. Types of Studies in Statistics
There are two main types of studies used to collect data and make statistical claims: observational studies and experiments.
Observational Studies: The researcher observes and records data without manipulating variables.
Experiments: The researcher manipulates one or more variables to observe their effect on other variables.
Key Differences:
- Experiments can establish causality; observational studies cannot.
- Observational studies are often easier and less expensive to conduct.
2. Observational Studies
Characteristics:
- No manipulation of variables by the researcher.
- Data is collected through observation or surveys.
- Can identify associations but not causality.
Types of Observational Studies:
- Cross-Sectional Studies: Data collected at a single point in time.
- Longitudinal Studies: Data collected over a period to observe changes over time.
- Case-Control Studies: Comparing groups with and without a certain outcome to identify factors associated with the outcome.
Strengths:
- Can study variables that are unethical or impractical to manipulate.
- Useful for studying multiple outcomes.
Limitations:
Prone to bias and confounding variables.
Cannot establish causation.
3. Experiments
Definition and Features:
Researchers manipulate one or more independent variables and measure their effect on dependent variables.
Often involve control groups and random assignment to reduce bias.
Randomized Controlled Trials (RCTs):
Considered the “gold standard” for experiments.
Participants are randomly assigned to different groups to ensure results are not biased by confounding factors.
Blinding and Placebos:
Blinding: Participants (and sometimes researchers) do not know which group participants are in to prevent bias.
Placebos: Inactive substances given to control groups to mimic the experimental conditions.
Strengths:
Can establish causal relationships.
A high level of control over variables reduces bias.
Limitations:
Often expensive and time-consuming.
Ethical concerns may limit the scope of experiments.
4. Evaluating the Validity of Statistical Claims
Biases to Consider:
- Selection Bias: When the sample is not representative of the population.
- Response Bias: When participants give inaccurate responses.
- Confounding Variables: Other variables that may affect the outcome.
Sample Size and Randomization:
Larger, randomized samples tend to provide more reliable results.
Replicability: The ability of a study’s findings to be replicated by others; a crucial component of scientific validity.
5. Common Misinterpretations and Misuses of Statistics
Correlation vs. Causation: Just because two variables are correlated does not mean one causes the other.
Misleading Graphs: Graphs can be manipulated to make data appear more significant than it is. Look for scales that are manipulated or data that is cherry-picked.
Selective Reporting: Only reporting data that supports a claim while ignoring data that does not.
Tips for SAT Math Problems on Evaluating Statistical Claims
- Distinguish between observational studies and experiments.
- Be skeptical of conclusions drawn from small sample sizes.
- Look for confounding variables that may affect the validity of claims.
Free Digital SAT Prep Course
SFBS offers a Free Digital SAT Prep Online Course. The course goes through particular skills and knowledge testing points and improves your problem-solving skills and test-taking strategies.
SAT Problem-Solving and Data Analysis Exercises
Exercise I. Alisa purchased a box of 100 tea bags. She uses one tea bag for each cup of tea. If Alisa drinks 3 cups of tea every day, in how many days will the number of tea bags in the box drop below 20?
Exercise II. A store offers a 20% discount on a certain bag. During the Black Friday promotion, an additional 10% discount is applied on all products in the store. If the final price of the bag is x % of the initial price, what is the value of x?
Exercise III. 1, 3, 7, 7, 8, 5, 2, 11
What is the sum of the median and mean of the data set shown?
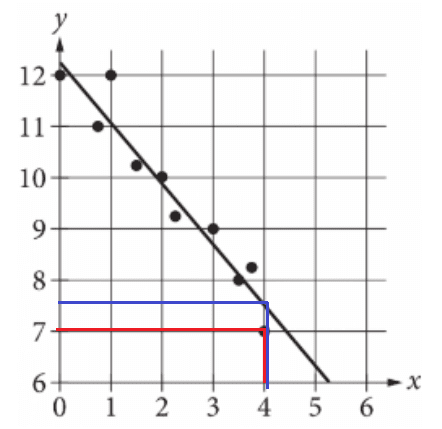
Exercise IV.
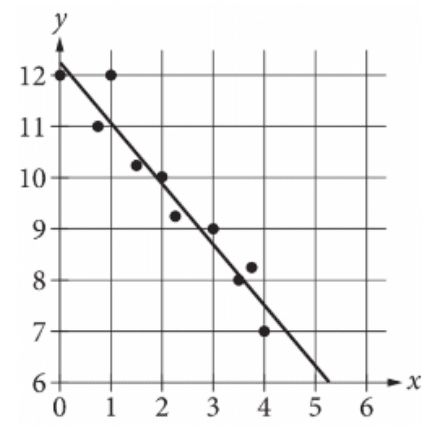
The scatterplot shows the relationship between two variables, x and y. A line of best fit for the data is also shown. What is the difference between the y-coordinate of the data point with x = 4 and the y-value predicted by the line of best fit at x = 4?
Exercise V. The following table shows the number of students in each grade in a High School.
| Grades | Number of Students |
| 9 | 105 |
| 10 | 101 |
| 11 | 100 |
| 12 | 72 |
25% of the Grade 12 students attend French club. If a student is picked randomly, what is the probability of selecting a Grade 12 student not attending the French club?
Exercise VI. A random sample of 60 people from a town with a population of 18,756 were asked for their opinion on a recent government policy. If 34 people in the sample support the government policy, what is the expected number difference between the supporters and non-supporters in the town?
Note: You can use a calculator in this SAT Math Exercise
Exercise VII. A study is conducted in the state of Utah. A sample of people over 50 years old are asked how many times they visit a doctor each year. What is the largest population to which the result of the survey can be generalized?
💡You can see our Free SAT Math Exercises which has 50 exercises on all SAT Math domains.
 . If we add 3x to both sides and subtract 20 from both sides of the equation;
 - (20) lt 20 + (3x) - (20)") . This yields;
. This yields; . If we divide both sides by 3;
/3 lt (3x)/3") . This yields;
. This yields; . The smallest integer greater than 26.66 is 27. Therefore, in 27 days, the number of tea bags in Alisa’s tea box will drop below 20.
 = Discount Amount.
 = Discount Amount.


 . If we substitute the values;
 If we divide both sides by p, this yields;
 + (5th Data Point))/2") . If we substitute the values;
. If we substitute the values;/2") . This yields;
. This yields; . We found the median.
 / (Number of Data Points)") . If we substitute the values;
. If we substitute the values; / 8") . This yields;
. This yields; . We found the mean.
 , or
, or 
 of Grade 12 students do not attend French club. There are 72 Grade 12 students. Therefore;
 54 Grade 12 students do not attend the French club.
/(Total number of students) = 54/378 = 1/7")
 . The difference between the supporters and non-supporters in the sample group is;
") . If we do cross-multiplication;
. If we do cross-multiplication; . If we divide both sides by 60;
 . We can conclude that the number of supporters will be around 2,501 greater than the number of non-supporters.
SAT Problem-Solving and Data Analysis Math Practice Test
We’ve listed 3 hard SAT Problem-Solving and Data Analysis practice test questions below. Note that this test does not resemble the typical question difficulty distribution in an SAT Problem-Solving and Data Analysis domain. Instead, we wanted to show you the hardest SAT Problem-Solving and Data Analysis questions you may see on the SAT.
Besides, since these are the hardest questions for the SAT Problem-Solving and Data Analysis, it is very normal that you will spend longer than usual time to solve each question. It is also super normal that you may score lower than your previous SAT Problem-Solving and Data Analysis Practice tests in this one. Because a typical Digital SAT Math Practice Test covers easy, medium, and hard questions. However, this one contains only the hardest questions.
Question 1
Anita created a batch of green paint by mixing 2 ounces of blue paint with 3 ounces of yellow paint. She must mix a second batch using the same ratio of blue and yellow paint as the first batch. If she uses 5 ounces of blue paint for the second batch, how much yellow paint should Anita use?
A. Exactly 5 ounces
B. 3 ounces more than the amount of yellow paint used in the first batch
C. 1.5 times the amount of yellow paint used in the first batch
D. 1.5 times the amount of blue paint used in the second batch
Skill and Knowledge Testing Point: Ratios, rates, proportional relationships, and units
Question 2
37% of the items in a box are green. Of those, 37% are also rectangular. Of the green rectangular items, 42% are also metal. Which of the following is closest to the percentage of the items in the box that are not rectangular green metal items?
A. 1.16%
B. 57.50%
C. 94.25%
D. 98.84%
Skill and Knowledge Testing Point: Percentages
Question 3
The mean amount of time that the 20 employees of a construction company have worked for the company is 6.7 years. After one of the employees leaves the company, the mean amount of time that the remaining employees have worked for the company is reduced to 6.25 years. How many years did the employee who left the company work for the company?
A. 0.45
B. 2.30
C. 9.00
D. 15.25
Content Domain: Problem-Solving and Data Analysis
Skill and Knowledge Testing Point: One-variable data: distributions and measures of center and spread
Question 4
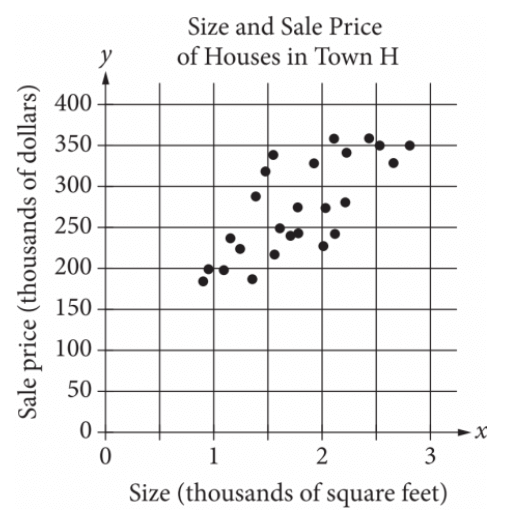
The scatterplot above shows the size x and the sale price y of 25 houses for sale in Town H. Which of the following could be an equation for a line of best fit for the data?
A. y = 200x + 100
B. y = 100x + 100
C. y = 50x + 100
D. y = 100x
Skill and Knowledge Testing Point: Two-variable data: models and scatterplots
Question 5
The table summarizes the distribution of age and assigned group for 90 participants in a study.
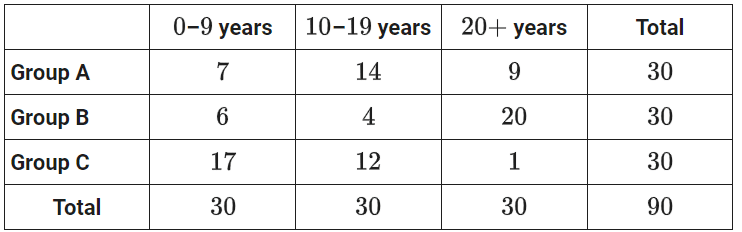
One of these participants will be selected at random. What is the probability of selecting a participant from group A, given that the participant is at least 10 years of age? (Express your answer as a decimal or fraction, not as a percent.)
Skill and Knowledge Testing Point: Probability and conditional probability
Question 6
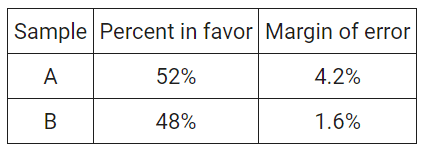
The results of two random samples of votes for a proposition are shown above. The samples were selected from the same population, and the margins of error were calculated using the same method. Which of the following is the most appropriate reason that the margin of error for sample A is greater than the margin of error for sample B?
A. Sample A had a smaller number of votes that could not be recorded.
B. Sample A had a higher percentage of favorable responses.
C. Sample A had a larger sample size.
D. Sample A had a smaller sample size.
Skill and Knowledge Testing Point: Inference from sample statistics and margin of error
Question 7
To determine the mean number of children per household in a community, Tabitha surveyed 20 families at a playground. For the 20 families surveyed, the mean number of children per household was 2.4. Which of the following statements must be true?
A. The mean number of children per household in the community is 2.4.
B. A determination about the mean number of children per household in the community should not be made because the sample size is too small.
C. The sampling method is flawed and may produce a biased estimate of the mean number of children per household in the community.
D. The sampling method is not flawed and is likely to produce an unbiased estimate of the mean number of children per household in the community.
Skill and Knowledge Testing Point: Evaluating statistical claims: observational studies and experiments
SAT Problem-Solving and Data Analysis Practice Test Answers and Rationales
We’ve created a comprehensive answers and rationales PDF file for these SAT Problem-Solving and Data Analysis questions. If you can fill in your name and email below, we can send it to your email in minutes. Note that, the PDF you will receive will have 19 questions from all SAT Math domains. Questions 9, 10, 11, 12, 13, 14, and 15 (Questions 9-15) are answers and rationales for this SAT Problem-Solving and Data Analysis Practice Test.
Note that, the email may hit your junk or spam folders, please check your junk and spam folders and if you did not receive it, please email us at support@sanfranciscobs.com.
💡Do not forget to visit SAT Math Practice Test – Hardest Questions. Assess your SAT Math skills with the hardest questions you may see on SAT Math.